
Figure 5.
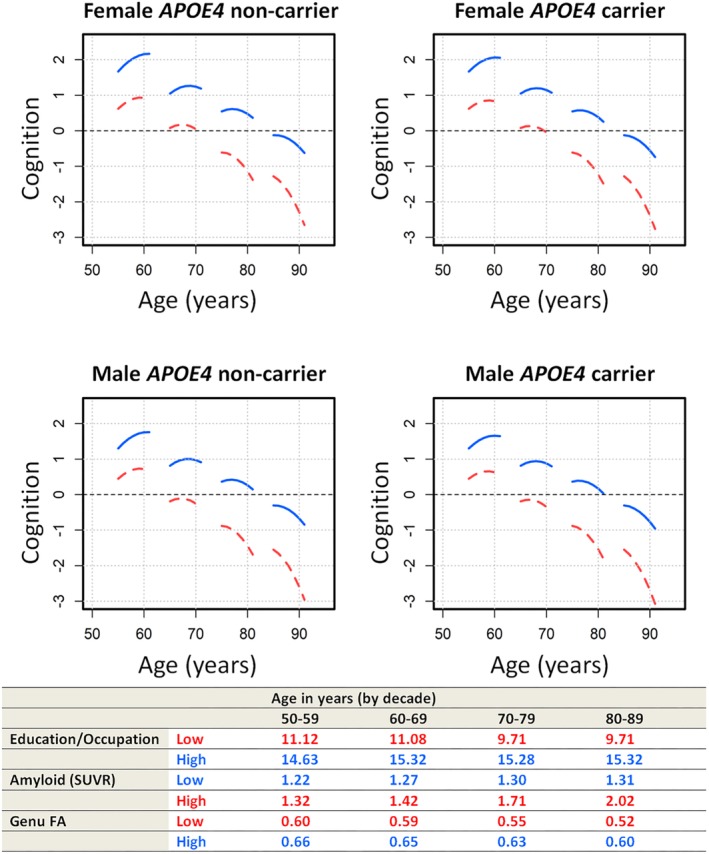
Complex process of cognitive aging. Red curves show worse values for all predictors (low education/occupation, high amyloid burden, low genu fractional anisotropy [FA]), and blue curves show the better values for all predictors (high education/occupation, low amyloid burden, high genu FA). Plots are shown for males versus females as well as APOE4 carriers versus APOE4 noncarriers. SUVR = standardized uptake value ratio. [Correction added on 25 October 2019, after first online publication: There was an error in the table portion at the bottom of Figure 5. The age range in the 3rd column has been changed from 60‐60 to 60‐69.]