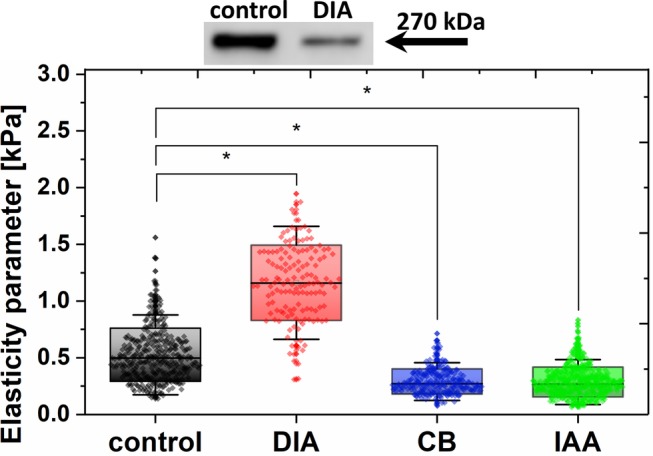
Figure 4.

Western blot of spectrin in control and DIA‐treated LSECs (500 μM, 5 minutes) (top). Elasticity parameter (effective Young's modulus) calculated from Hertz‐Sneddon model fit to the force‐distance curves taken at the nuclear part of live LSECs, both untreated and treated with DIA (500 μM), CB (21 μM) or IAA (10 μM) (bottom). The boxes indicate SD (SD), with a line and black dot indicating the median and mean value, respectively. *P < .001
