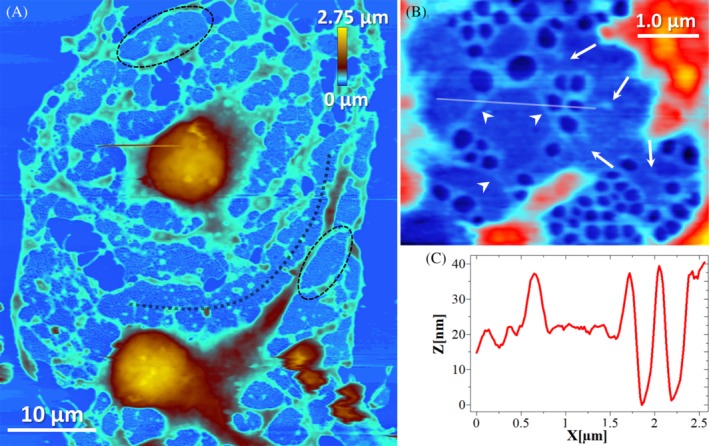
Figure 5.

AFM image showing GA‐fixed LSECs after 30 minutes of CB treatment (21 μM). A, A bulging nucleus area (brown‐orange, >400 nm) is observed. Cell height on the periphery rarely exceeds 400 nm (blue, <400 nm). Black outlines indicate examples of the individual sieve plates, but some sieve plates are merged (eg, black dotted line). B, Magnification of a single sieve plate. Each fenestra in the sieve plate is surrounded with FACR. Actin filaments are often connected to each other and form long filaments (arrowheads). Incompletely closed FACRs do not contain an open pore within (arrows). C, A cross section presents the height of the FACR and flat regions within the sieve plate
