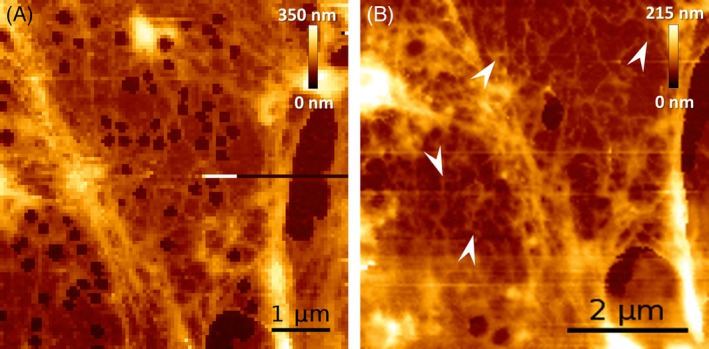
Figure 6.

AFM images highlighting FACRs in LSECs. A, Peripheral part of an LSEC sieve plate presenting fenestrated morphology (control). A net of FACRs can be observed as brighter (higher) parts within the cell cytoplasm. B, After injection of 500 μM DIA to the medium, a similar area of the same LSEC was visualized and shows immediate (<5 minutes) closing of the fenestrae. The measurement initiated after ~3 minutes (8 minutes long) from the injection presents the F‐actin filament structure around FACR (arrowheads)
