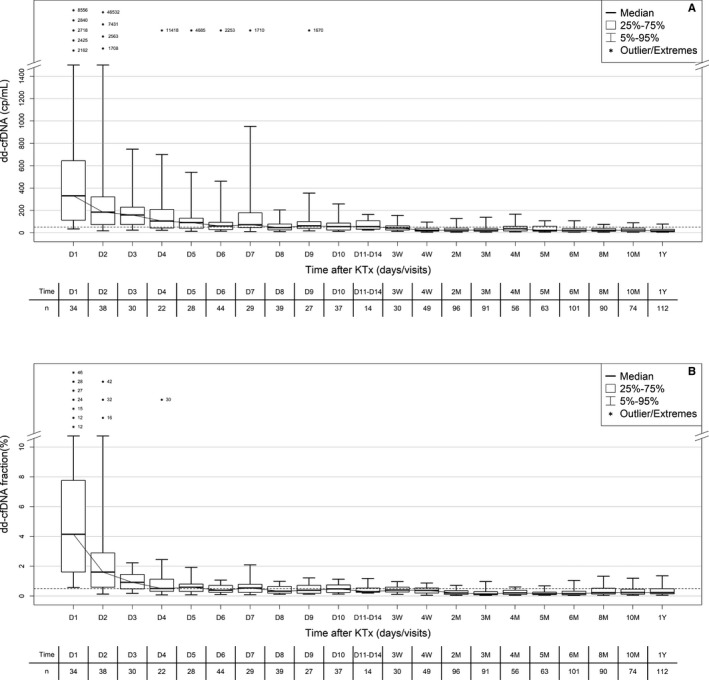
Figure 2.

Time course in plasma dd‐cfDNA(cp/mL) (A) and dd‐cfDNA(%) (B) during the first year after KTx in patients' samples of Non‐rejecting Phase. Boxes represent median with interquartile range, with whiskers showing the 5th‐95th percentile. Predetermined visits and number of samples (n) are given below each time point. Values for outliers are shown as numbers (either as cp/mL or %). dd‐cfDNA, donor‐derived cell‐free DNA; KTx, kidney transplant
