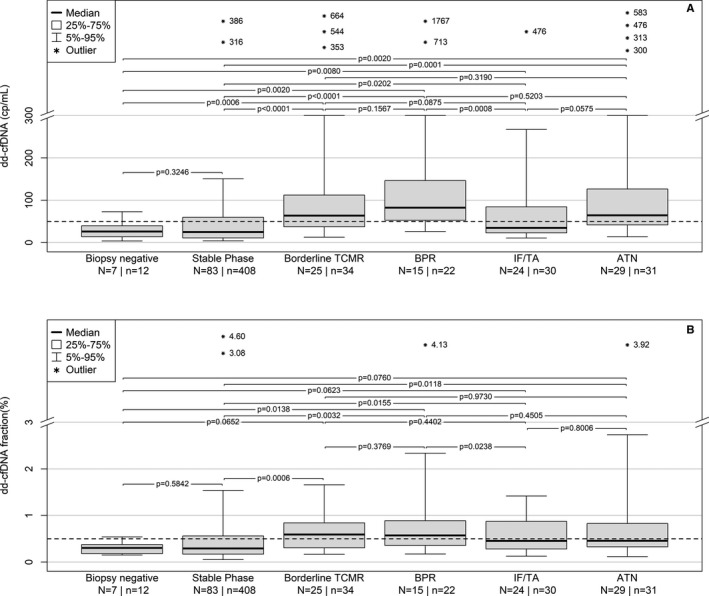
Figure 3.

Comparison of post KTx dd‐cfDNA(cp/mL) (A) and dd‐cfDNA(%) (B) data from samples beginning at day 5 post‐KTx. ATN, acute tubular necrosis; BPR, biopsy‐proven rejection; dd‐cfDNA, donor‐derived cell‐free DNA; KTx, kidney transplant; TCMR, T cell‐mediated rejection
