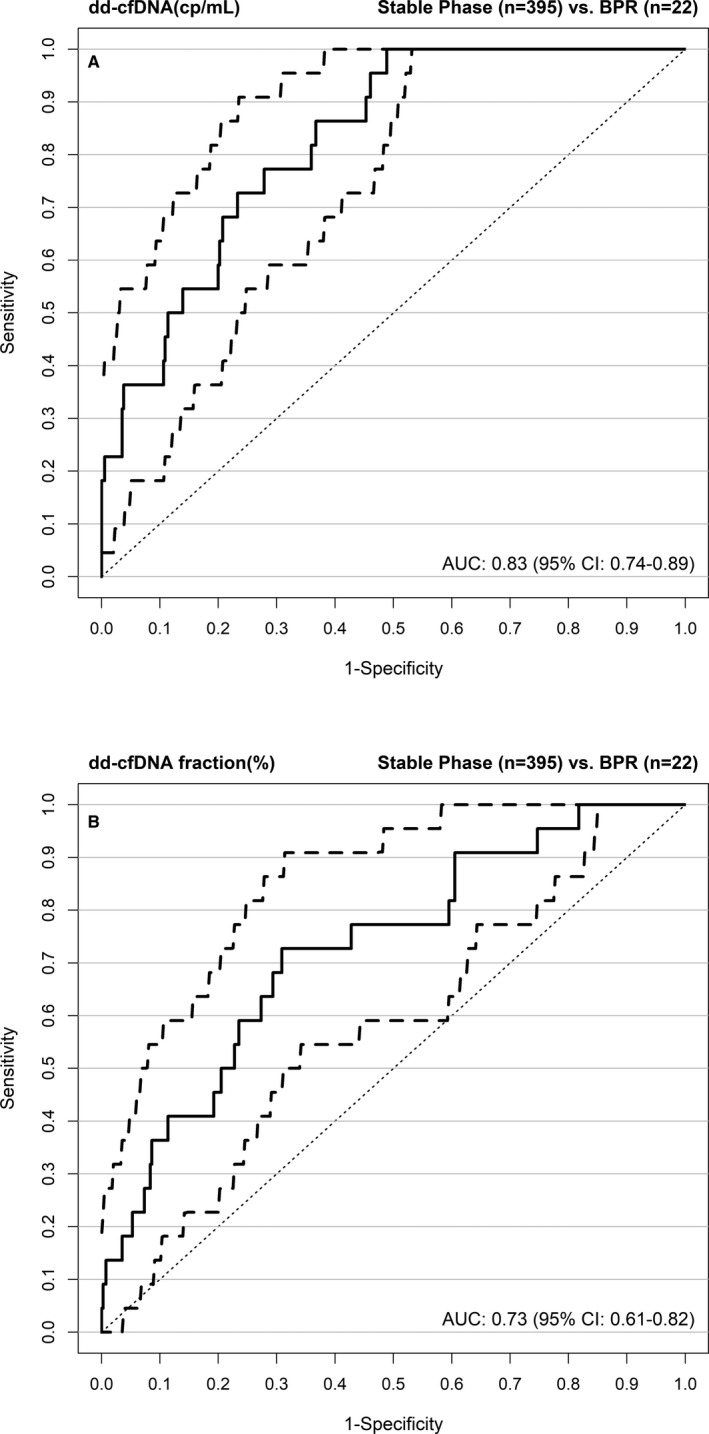
Figure 4.

ROC curves for dd‐cfDNA(cp/mL) (A) and dd‐cfDNA(%) (B) showing the superior performance (P = .02) of measuring the absolute amount (cp/mL) of dd‐cfDNA rather than the dd‐cfDNA fraction(%). Outliers in the Stable Phase group were excluded from analysis. AUC, area under the curve; BPR, biopsy‐proven rejection; CI, confidence interval; dd‐cfDNA, donor‐derived cell‐free DNA; ROC, receiver operating characteristic
