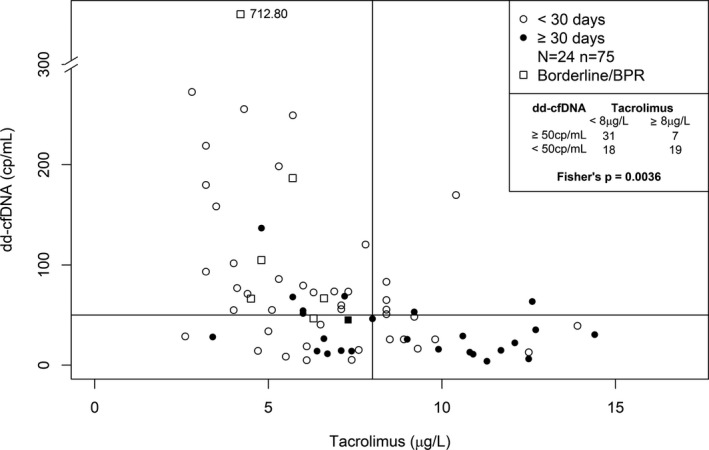
Figure 6.

Association between low predose tacrolimus concentrations and increased dd‐cfDNA(cp/mL) in patients (N = 24) with a change of tacrolimus concentration >60% in samples (n = 75) collected at three consecutive visits. Lines represent the cut‐off points for Fisher test (Tacrolimus: 8 μg/L; dd‐cfDNA: 50 cp/mL). BPR, biopsy‐proven rejection; dd‐cfDNA, donor‐derived cell‐free DNA
