
Figure 4.
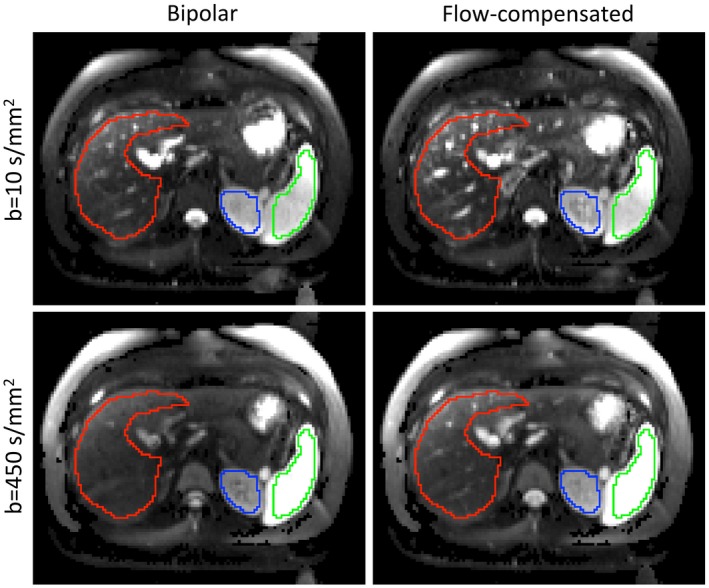
Example images (after registration, PCA denoising, and maximum intensity projection) of b = 10 s/mm2 and b = 450 s/mm2 acquired with bipolar (left) and FC (right) gradients. Note that signal decay in vessels is less apparent in the FC scheme. ROIs: red, liver; green, spleen; blue, kidney