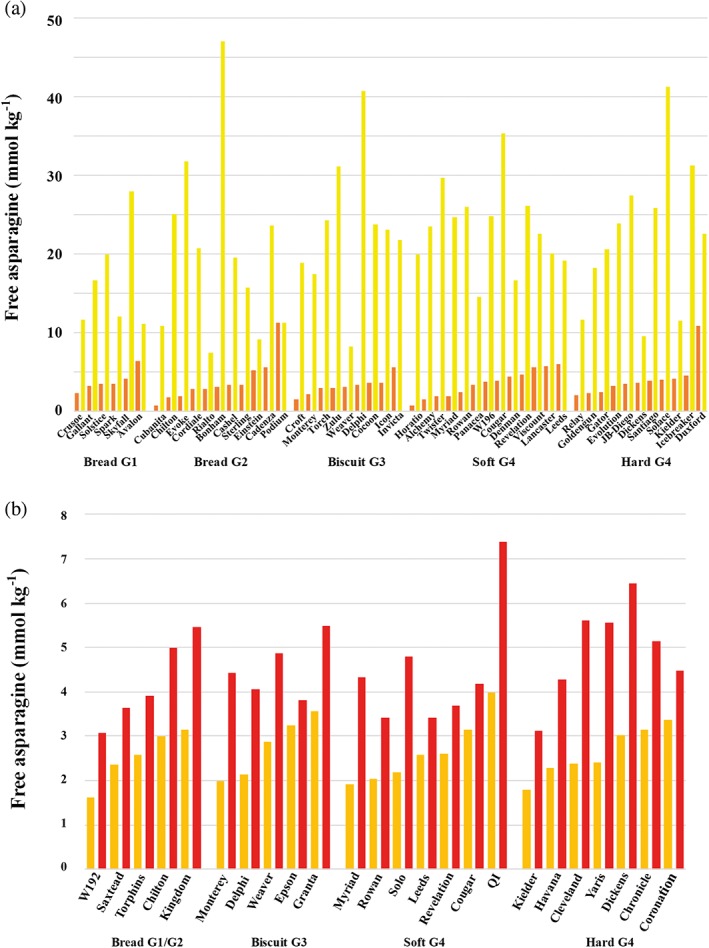
Figure 11.

Effects of crop management on free asparagine concentration in wheat. (a) Mean free asparagine concentration in the grain of 50 varieties of winter wheat grown in a field trial in 2012–2013. Data are shown from split‐plots in which wheat in half the plot was supplied with nitrogen and sulphur (brown bars), while the wheat in the other half was supplied with nitrogen but not sulphur (yellow bars). The varieties are grouped according to their classification by the National Association of British and Irish Millers (NABIM), in ascending order for free asparagine concentration in the sulphur supplied condition within each group. There were significant effects of treatment (sulphur supply) (p = .007), type interacting with treatment (p = .002) and the three‐way interaction of treatment, type and variety nested in type (p < .001). Replotted from data provided by Curtis, Powers, et al. (2018). (b) Mean free asparagine concentration in the grain of 24 varieties of wheat grown in a field trial in the United Kingdom in 2011–2012 in which plots were either treated with fungicides (orange) or left untreated (red). There was a strong combined effect of genotype and crop management but this could not be assessed statistically as the untreated plots were not replicated. Replotted from data provided by Curtis et al. (2016)
