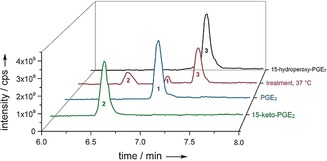
Figure 4.

UHPLC‐MS profiles for 3 (black, red at 7.36 min) and its degradation products 2 and 1 (red at 6.5 min and 7 min) formed at 37 °C (for 24 h) in comparison to PG standards: 1 (blue) at 7 min; 2 (green) at 6.5 min. All profiles were measured in negative ionization mode and the total ion count in full MS is plotted. Note that the detector response for the ionization of 1 and 2 is different and that, after normalization with external standards, observed peak areas in the treatment at 37 °C correspond to equal molar amounts (see SI‐Figure 8 and SI‐Table 7).
