Figure 5.

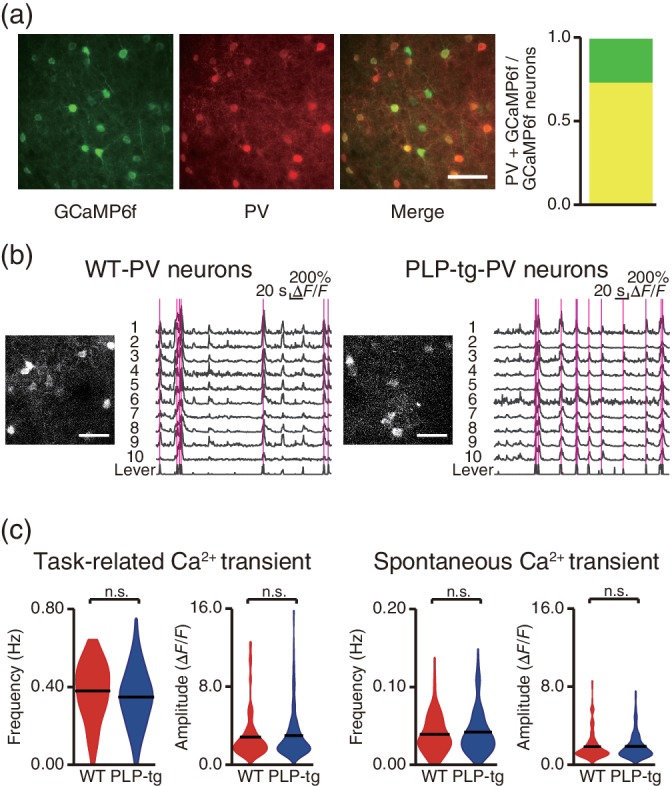
PLP‐tg mice did not have apparent defects in the function of inhibitory neurons. (a) GCaMP6f expression and PV immunostaining from a PV‐Cre mouse that was injected with rAAV2/1‐CAG‐flex‐GCaMP6f. Proportion of PV‐positive neurons (yellow) out of all GCaMP6f‐expressing neurons (142 PV‐positive neurons and 194 GCaMP6f‐expressing neurons in four slices from two mice). Scale bar, 50 μm. (b) Representative two‐photon images, Ca2+ traces, and the corresponding lever trajectory (bottom trace in each plot) from a WT/PV‐Cre mouse (left) and PLP‐tg/PV‐Cre mouse (right) recorded during the task on Day 1. The magenta vertical lines indicate successful lever pulls. Scale bar, 50 μm. (c) The frequency and amplitude of task‐related and spontaneous Ca2+ transients in PV neurons on Day 1 (n = 115 from five fields in four WT/PV‐Cre mice, n = 145 from nine fields in five PLP‐tg/PV‐Cre mice, task‐related: frequency, p = .051, Wilcoxon rank sum test; amplitude, p = .63, unpaired t test; spontaneous: frequency, p = .72, Wilcoxon rank sum test; amplitude, p = .86, unpaired t test). Violin plot shows the mean (black lines) and distribution of the data. n.s.: nonsignificant
