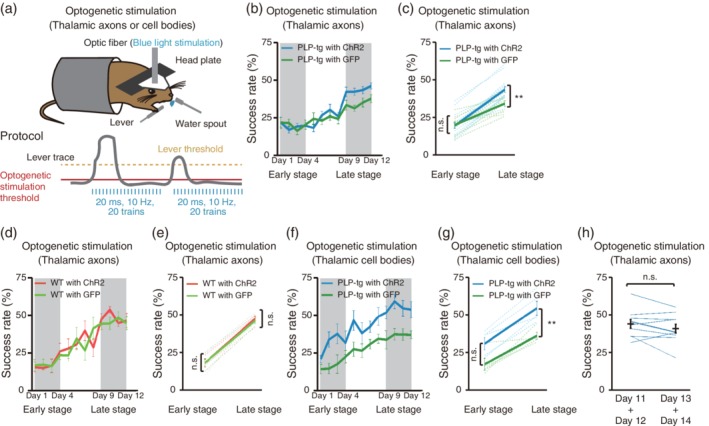
Figure 8.

Effects of optogenetic stimulation of thalamic neurons on motor learning. (a) Schematic of the optogenetic stimulation‐assisted lever‐pull task. Repetitive optogenetic stimulation of thalamocortical axons or thalamic cell bodies was triggered when the lever position crossed a threshold. (b) Time course of the 60 min‐averaged lever‐pull success rate in PLP‐tg mice with optogenetic stimulation of ChR2‐ (n = 16; light blue) or GFP‐ (n = 10; green) expressing thalamocortical axons. (c) Success rate in early (Days 1–4) and late (Days 9–12) training stages in PLP‐tg mice with blue light illumination of ChR2‐ (light blue) or GFP‐ (green) expressing thalamocortical axons (F 1,48 = 4.73, p = 1.0 [early], p = 0.0097 [late], two‐way ANOVA followed by Tukey's test). Data are presented as the mean ± SEM. **p < .01, n.s.: nonsignificant. (d) Time course of the 60 min‐averaged lever‐pull success rate in WT mice with optogenetic stimulation of ChR2‐ (n = 5; light red) or GFP‐ (n = 5; light green) expressing thalamocortical axons. (e) Success rate in early (Days 1–4) and late (Days 9–12) training stages in WT mice with ChR2‐ (light red) or GFP‐ (light green) expressing thalamocortical axons during optogenetic stimulation (F 1,16 = 0.09, p = 1.0 [early], p = .97 [late], two‐way ANOVA followed by Tukey's test). Data are presented as the mean ± SEM. n.s.: nonsignificant. (f) Time course of the 60 min‐averaged lever‐pull success rate in PLP‐tg mice with optogenetic stimulation of ChR2‐ (n = 5; light blue) or GFP‐ (n = 5; green) expressing thalamic cell bodies. (g) Success rate in early (Days 1–4) and late (Days 9–12) training stages in PLP‐tg mice with ChR2‐ (light blue) or GFP‐ (green) expressing thalamic cell bodies during optogenetic stimulation (F1, 16 = 20.63, p = .063 [early], p = .0098 [late], two‐way ANOVA followed by Tukey's test). Data are presented as the mean ± SEM. **p < .01, n.s.: nonsignificant. (h) Success rates averaged over Days 11 and 12 (left) and over Days 13 and 14 (right) in ChR2‐expressing PLP‐tg mice with optogenetic stimulation during Days 1–12, but not Days 13 and 14 (p = .24, n = 10, paired t test). Black lines indicate the mean ± SEM. n.s.: nonsignificant
