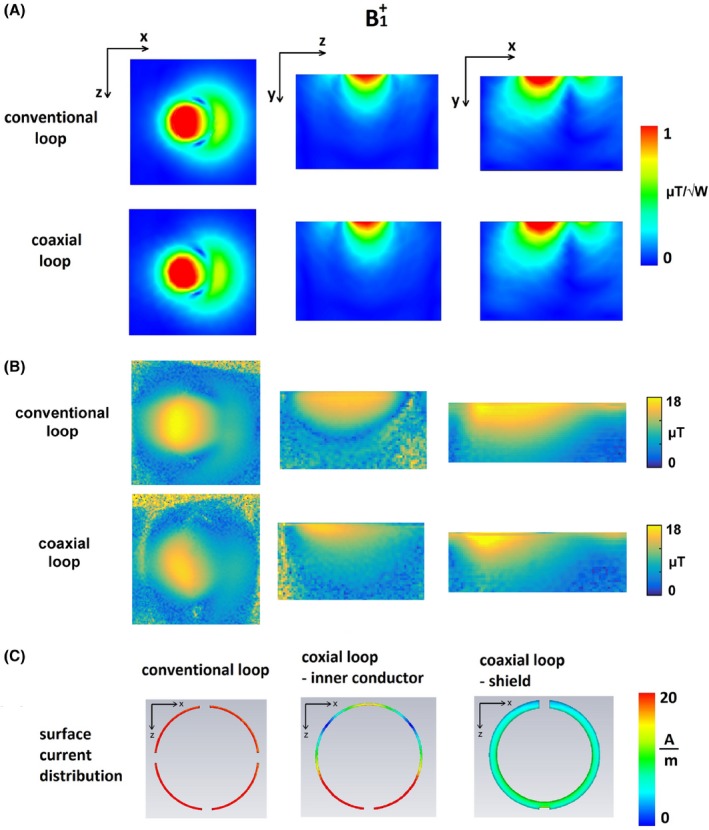
Figure 3.

(A) Simulated distributions of conventional and coaxial loops, normalized to 1 W of accepted power. (B) Measured distributions of conventional and coaxial loops. (C) Surface current distributions on conductor of conventional loop (left), inner conductor of SCC (middle), and on shield of SCC (right)
