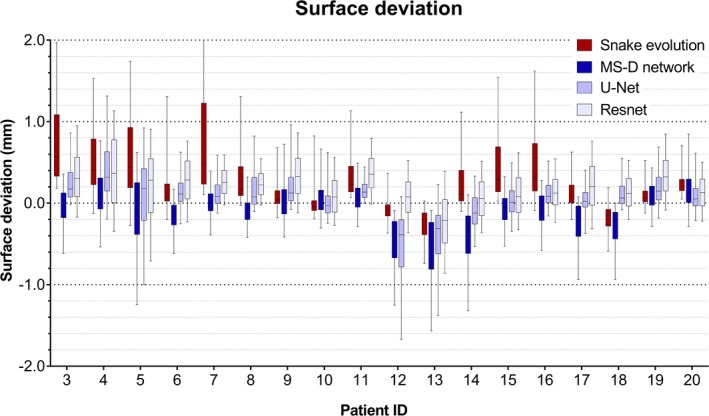
Figure 5.

Box and whisker plot of the surface deviations between the standard tessellation language (STL) models acquired using the snake evolution algorithm, MS‐D network, U‐Net, ResNet, and the corresponding gold standard STL models. The boxes represent the interquartile range and the whiskers represent the 10th and 90th percentiles of the surface deviations. [Color figure can be viewed at http://wileyonlinelibrary.com]
