
Figure 4.
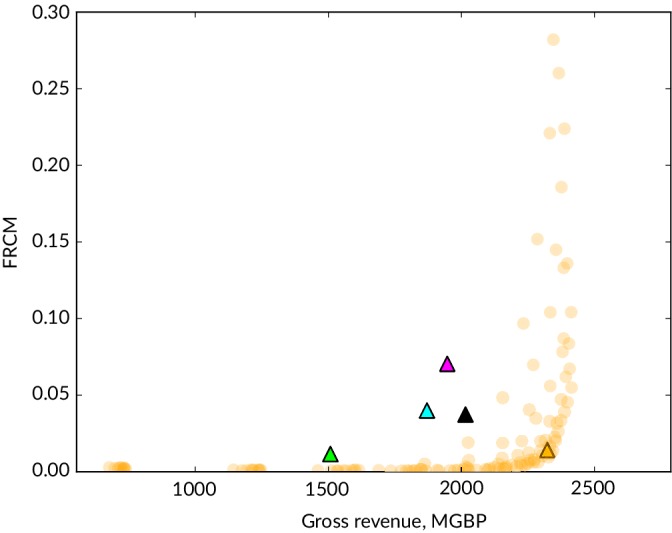
Expected outcomes for gross catch revenue and risk of stock depletion (FRCM) for the 120 simple harvest control rule variants ( ) as compared with assessment‐based single species fishing mortality rate (
 ),multispecies Nash Equilibrium (
 ),upper pretty good yield (PGY) ranges (
 ),mid PGY ranges (
 ) and lower PGY ranges (
 )
)