
Figure 3.
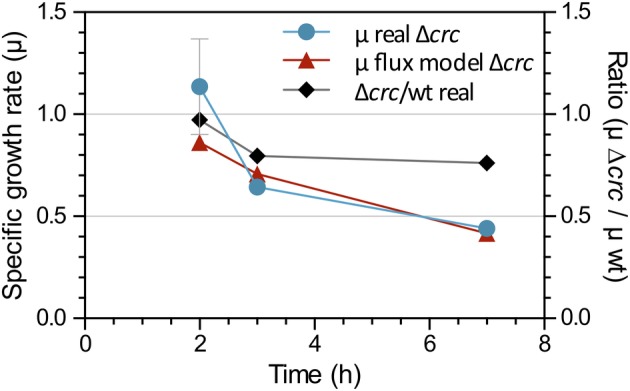
Growth rate (μ) of cells during the early‐, mid‐ and late‐exponential phases of growth. Blue, values determined experimentally for the Crc‐null strain measuring the increase in cell dry weight (error bars indicate the standard deviation of three biological replicates). Red, values predicted by the flux model for the Crc‐null strain. The ratio of the experimentally determined growth rates for the Crc‐null versus the wild‐type strain at each growth phase is indicated in black.