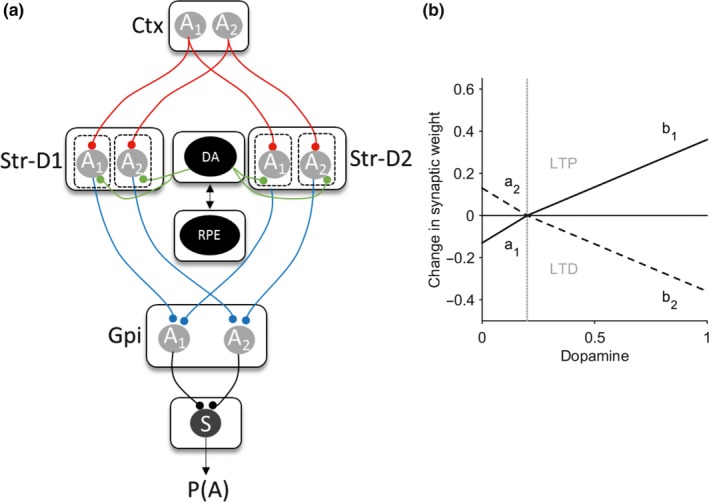
Figure 2.

Basal ganglia plasticity model. (a) Schematic model architecture. Nuclei include the direct pathway striatal neurons (Str‐D1), indirect pathway (Str‐D2), and globus pallidus interna (GPi). Gray circles represent the available two actions (A 1 and A 2) represented in the cortex (Ctx) and subcortical nuclei. Red lines represent excitatory connections, blue inhibitory. Green represents the neuromodulatory influence of dopamine on the striatum. Functions critical to the model include the dopamine‐weight change function (DA), the reward prediction error signal (RPE), and the softmax (S) equation. The value of an action is assumed to be represented in the cortex (Ctx) for one of two actions (A 1 and A 2). The striatal output is determined by the product of the cortico‐striatal synaptic weight and the cortical input for the action. The NoGo activity of one action was subtracted from its “Go” D1” self (i.e., Gpi(A1) = StrD1(A1)−StrD2(A1). The pallidal activity for each action is then converted into a choice probability p(A) by entering this into the softmax function (S). (b) The expected change in synaptic weight as a function of dopamine released is represented by the dopamine‐weight change curve (DA). The four plasticity coefficients (a 1, b 1, a 2, b 2) in the model determine the gradients of this function, which in turn govern the magnitude of LTP and LTD at the cortico‐striatal synapse. The solid line represents the D1 dopamine‐weight changes, the dashed line the D2 equivalent. The gray vertical line represents the point of inflection at which dopamine is considered above or below baseline levels, corresponding to phasic “bursts” or “dips” in the reward prediction error signal [Colour figure can be viewed at http://wileyonlinelibrary.com]
