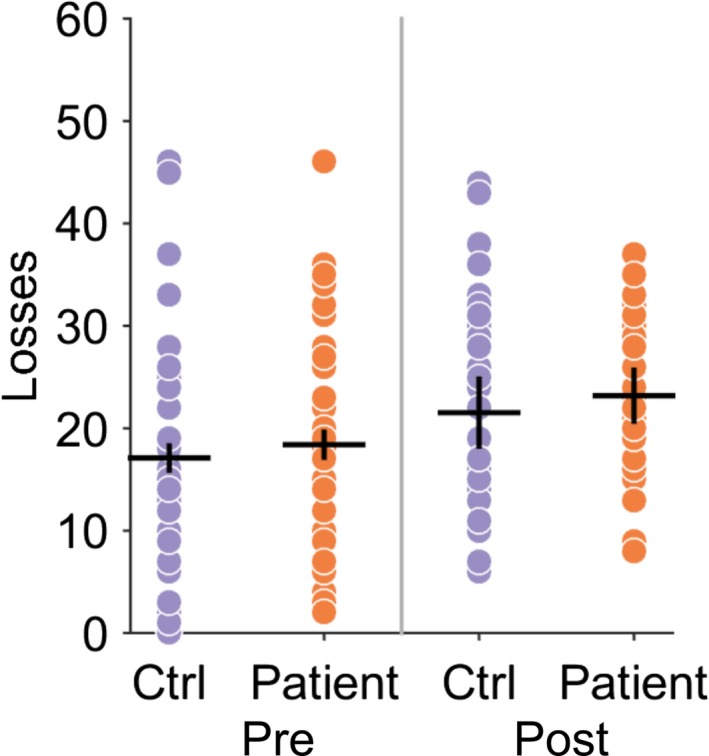
Figure 5.

Loss avoidance learning in patients and controls. Individual performance in patients (red dots) and controls (blue) demonstrates no significance difference in loss avoidance performance. Black crosses represent mean and 95% confidence limits [Colour figure can be viewed at http://wileyonlinelibrary.com]
