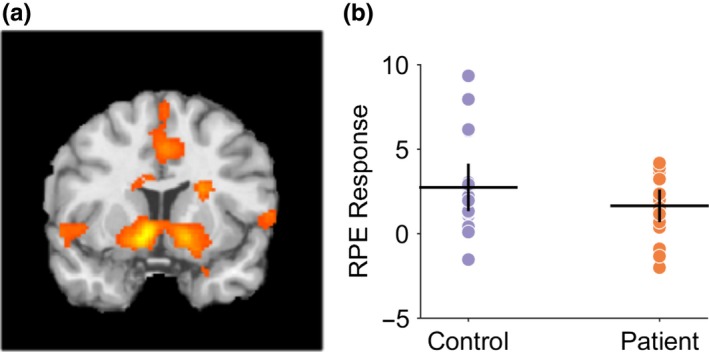
Figure 6.

Reward prediction error encoding in controls and patients during reversal learning task. (a) Controls exhibited prediction error encoding within the striatum with maximal clusters in the left putamen, MNI co‐ordinates [−10,10,−6], T‐value = 5.14, and right caudate nucleus, MNI co‐ordinates [10,7,−10], T‐value = 5.08, both p < 0.01, cluster extent corrected across the whole brain. There was no significant between‐group differences (at p = 0.05) suggesting comparable prediction error encoding in patients and controls. (b) Region of interest analysis from left putaminal RPE‐fMRI signal in controls and patients with mean and 95% confidence limits supporting comparable levels of RPE signaling in both groups [Colour figure can be viewed at http://wileyonlinelibrary.com]
