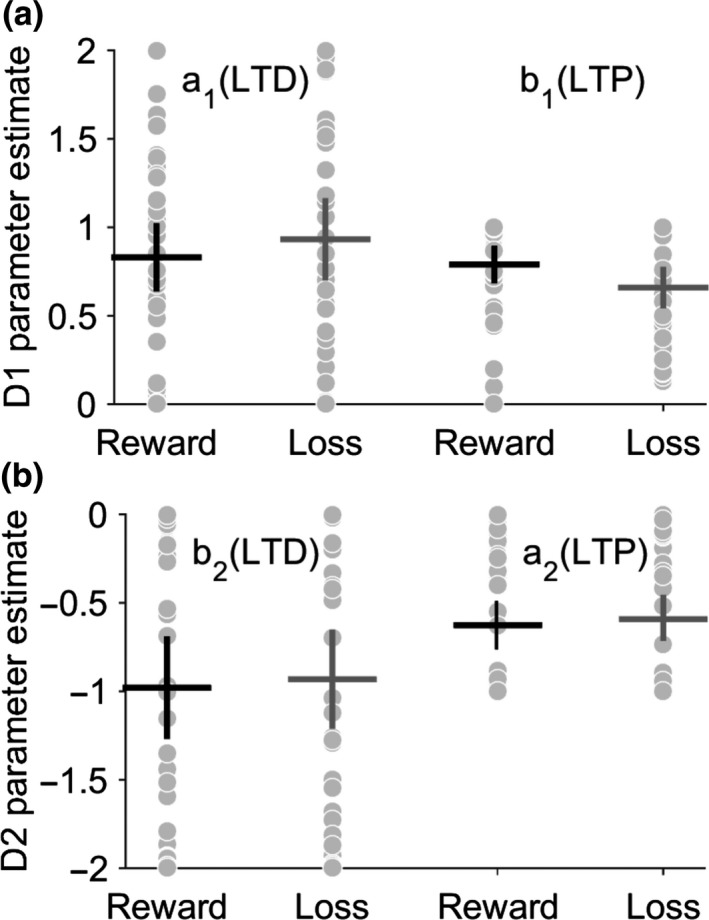
Figure 8.

Basal ganglia model fitting recovers realistic plasticity parameter estimates for controls. Final plasticity parameter estimates for D1 in (a) and D2 (b) coefficients. Reward and loss avoidance were fitted separately with individuals estimates represented by gray dots. Mean and 95% confidence limits represented by black and gray crosses for reward and loss, respectively. The average plasticity parameter values were a 1 = 0.83 ± 0.55, b 1 = 0.78 ± 0.27, a 2 = −0.97 ± 0.85, b 2 = −0.62 ± 0.37 for reward and a 1 = 0.93 ± 0.67, b 1 = 0.65 ± 0.31, a 2 = −0.93 ± 0.82, b 2 = −0.59 ± 0.38 for the loss avoidance task
