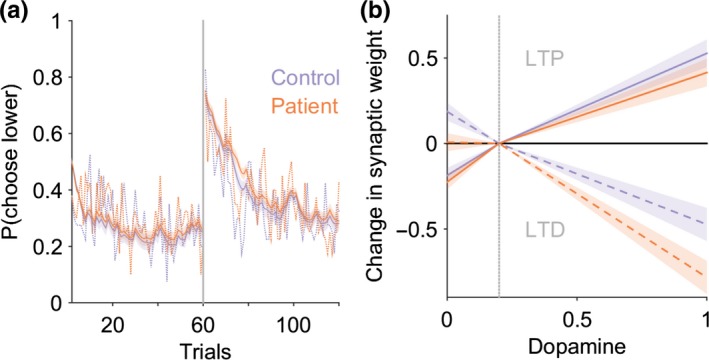
Figure 9.

Loss avoidance learning in cervical dystonia is best explained by a model of the basal ganglia with abnormal D2 cortico‐striatal plasticity. (a) Average probability of choosing low value actions “A1” and “A2” pre‐ and post‐reversal reversal of contingencies in the reward task. Patient average choice probability in red, controls in blue. Vertical dotted line represents the point of contingency reversal. Dashed lines represent experimental behavior from patients and controls. The basal ganglia models performance following estimation of the optimal model parameters is superimposed (solid lines with 95% confidence limits represented by the shaded region). The models behavior closely overlaps with the experimental behavior of both the patients and controls. Despite no behavioral difference in the loss avoidance learning, a basal ganglia model with increased D2‐LTD : LTP explained the patients loss avoidance strategy best in 31 of the 40 patients fitted. (b) The average dopamine‐weight change curve for the patients (red) and controls (blue) with 95% confidence limits represented by the shaded region. Solid lines represent D1 and dashed lines represent D2 curves, respectively [Colour figure can be viewed at http://wileyonlinelibrary.com]
