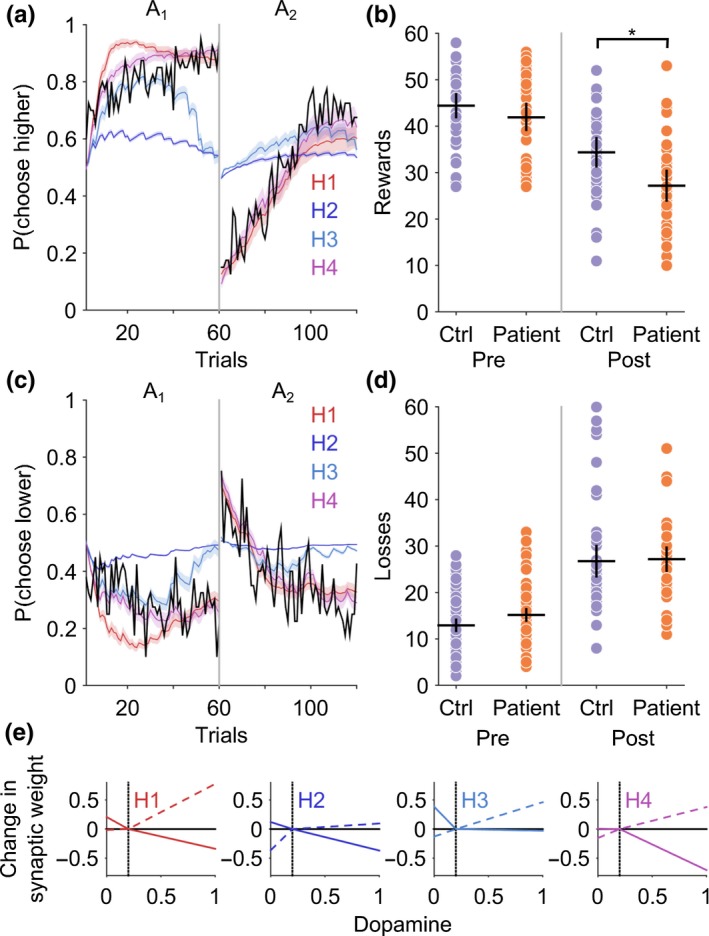
Figure 10.

Model hypotheses comparison and generated behavior in reward and loss avoidance tasks. (a) and (c) The mean choice probability for the high and low value fractal for the patients is plotted in black. Superimposed are the result of fitting the basal ganglia model to each of the four hypothetical plasticity abnormalities (H1, D1 increased LTP : LTD; H2, D1 increased LTD : LTP; H3, increased D2 LTP : LTD; H4, increased D2 LTD : LTP). Average model choice probabilities with 95% confidence limits represented by the shaded area. (b) Behavioral data generated by the basal ganglia model performing the task with the “winning” hypothesis H4 (increased D2 LTD: LTP) reproduces the post‐reversal reward impairment (*p < 0.01) with similar loss avoidance performance in patients and controls (d). (e) Final dopamine‐weight change curves for each of the four hypothetical abnormalities in D1 or D2 cortico‐striatal plasticity. Dashed lines D1, solid lines D2 [Colour figure can be viewed at http://wileyonlinelibrary.com]
