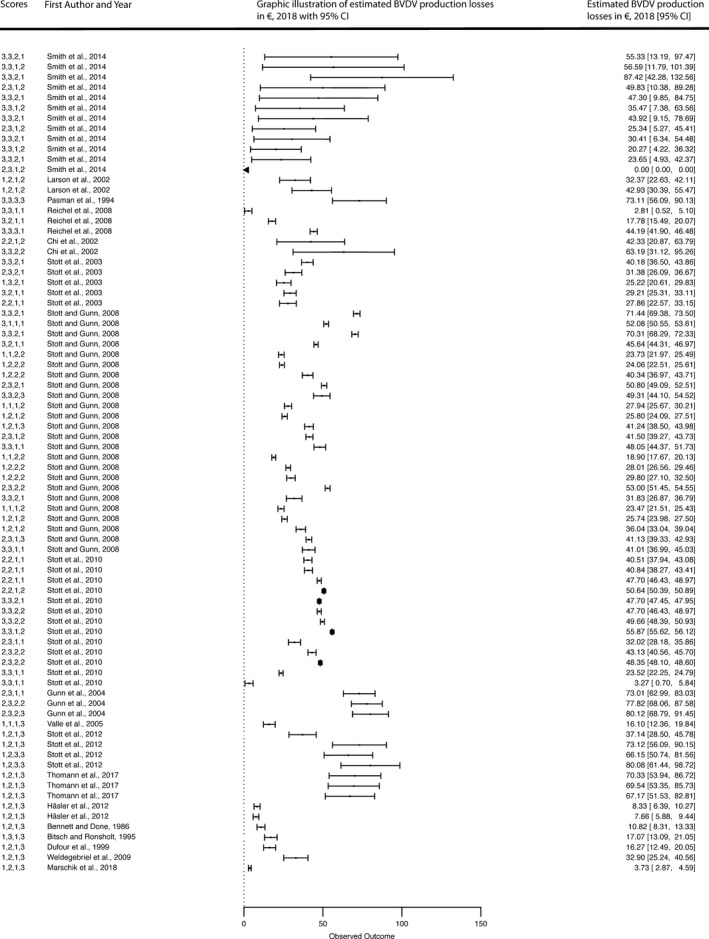
Figure 3.

Forest plot of the meta‐analysis models including the significant epidemiological factors (“build used” factors of Table 1). The column on the right refers to the mean annual BVDV production losses per animal with the corresponding confidence intervals (shown in brackets). The different single numbers attached before the authors' names (left column) represent the “build used” factors of Table 1. The numbers represent the following scores, i.e., 1 = low; 2 = moderate and 3 = high. The order of the numbers can be classified as follows: first number covered BVDV introduction risk, followed by initial prevalence, circulation intensity and duration (see also Table S1). N.B. the forest plot may include the same combination of numbers more than one before the authors’ names within a study because different sets of input parameters were used, resulting in different estimated mean annual production losses per animal. The grey diamonds represent the effect size adjusted for the “build used” epidemiological factors. Forest plots of mitigation measures are provided in Supplementary Figure S5–S6. N.B. Full references of authors shown in the forest plots are available in Supplementary Table S4
