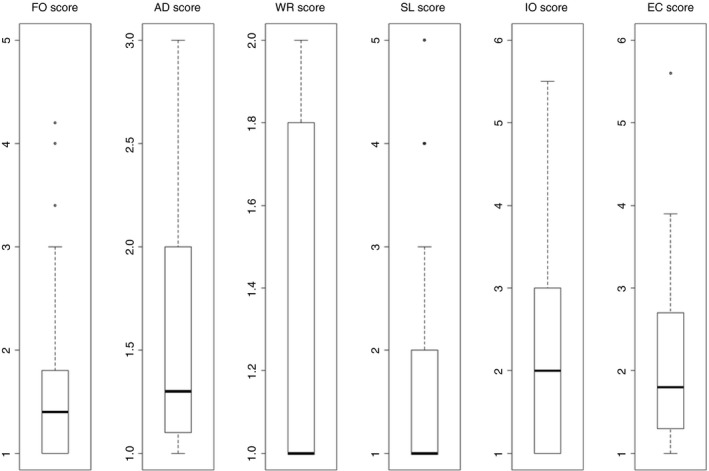
Figure 2.

PEmb‐QoL dimension scores. Higher scores indicate decreased QoL. AD, activities of daily living limitations; EC, emotional complaints; FO, frequency of complaints; IO, intensity of complaints; SL, social limitations; WR, work‐related problems
