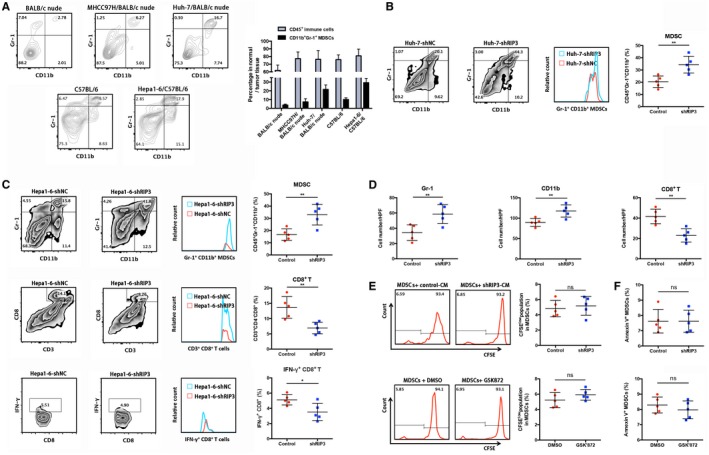
Figure 3.

Hepatic RIP3 deficiency drives MDSC recruitment to promote tumor progression. (A) Different human and mouse HCC cell lines were orthotopically implanted into the left lobes of the livers of BALB/c nude or C57BL/6 mice. Harvested tumors were dissociated, and the percentages of CD11b+Gr+ MDSCs were evaluated by flow‐cytometric analysis. (B) Representative CD11b+Gr‐1+ MDSC zebra plots are shown in tumor tissues from orthotopic HCC models (n = 5, nude mice) of Huh‐7–shNC and Huh‐7–shRIP3 following a leukocyte gate (CD45+).
**P < 0.01. (C) Representative CD11b+Gr‐1+ MDSCs, CD3+CD8+ T cells, and IFN‐γ+CD8+ T cell zebra plots are shown in tumor tissues from orthotopic HCC models (n = 5, C57BL/6) of Hepa1‐6–shNC and Hepa1‐6–shRIP3 following a leukocyte gate (CD45+). *P < 0.05, **P < 0.01. (D) Immunostained cell count in Hepa1‐6–shNC and Hepa1‐6–shRIP3 orthotopic tumors from immunocompetent mice (n = 5). Gr‐1+ (left), CD11b+ (middle), and CD8+ (right). **P < 0.01. (E) The percentage of 5(6)‐carboxyfluorescein succinimidyl ester low population represents the proportion of proliferating MDSCs. Representative flow‐cytometric data and a statistical diagram are shown. (F) The percentage of Annexin V+ MDSCs represents the proportion of apoptotic MDSCs. A statistical diagram is shown. Abbreviations: CFSE, 5(6)‐carboxyfluorescein succinimidyl ester; DMSO, dimethyl sulfoxide; HPF, high power field; ns, nonsignificant.
