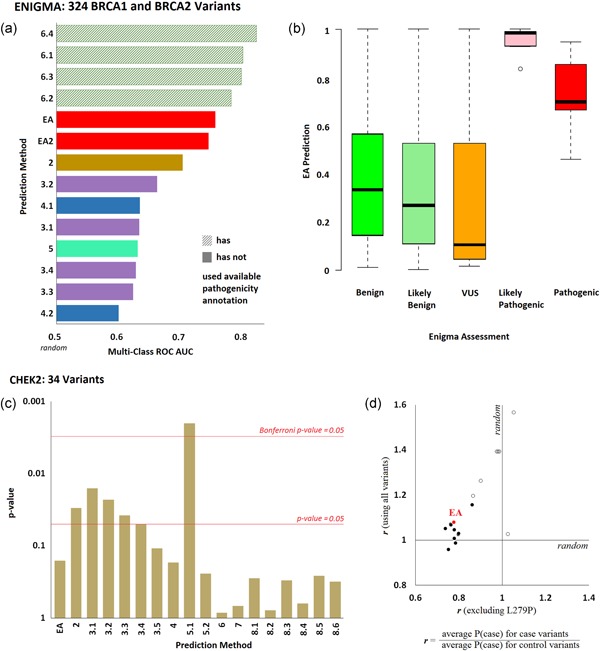
Figure 3.

Effect of variants on clinical presentation. (a) ENIGMA Challenge: Fourteen submissions aimed to predict the clinical effect of 146 BRCA1 and 178 BRCA2 variants, which were classified using multifactorial likelihood analysis. The bars represent the multiclass area under the ROC curves of each submission, as calculated by the CAGI assessor (colors correspond to each research team; the pattern fill corresponds to submissions that used clinical annotation from other sources to predict the ENIGMA annotations). (b) The whisker diagram shows the EA prediction values for each pathogenicity class. (c) CHEK2 Challenge: Eighteen submissions aimed to predict the probability for each of 34 CHEK2 variants to occur in a case cohort rather than in a control cohort. The bar plot shows the p‐values for the agreement of predictions and observations, as calculated by the CAGI assessor. The red horizontal lines correspond to statistical significance levels and they were added by the authors. (d) The ratio of the average prediction P(case) for the variants seen in cases over the average prediction P(case) for the variants seen in controls, when the L279P variant was included (y‐axis) or excluded (x‐axis). Open circles represent submissions in the scale of 0–1, while the solid circles represent submissions in the scale of 0.5–1. The EA submission is shown with red color. CAGI, Critical Assessment of Genome Interpretation; EA, Evolutionary Action; ROC, receiver operating characteristic
