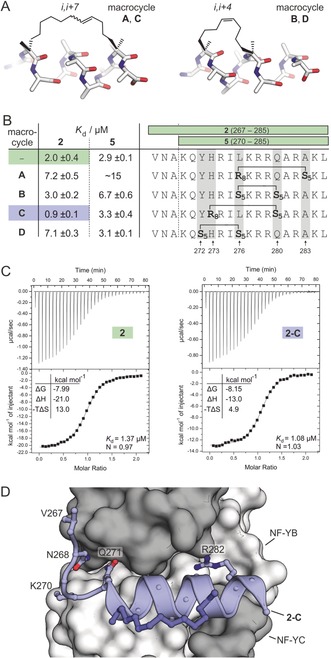
Figure 2.

A) Model structures of hydrocarbon‐stapled peptides with i,i+7 (macrocycle A, C) and i,i+4 (macrocycle B, D) crosslinks. B) Sequences of modified peptides and their K d values as determined by FP (errors account for 1σ, measurements performed as triplicates, binding curves are shown in Figure S5). C) Representative ITC curves of 2 and 2‐C (measurements were performed in triplicate; for full data see Table S3 and Figure S8/ S9). D) Crystal Structure (PDB ID: 6qms, Table S2) of 2‐C (blue cartoon representation) in complex with NF‐YB/C (grey surface representation). Selected 2‐C side chains are shown as ball‐and‐stick representations.
