Figure 3.

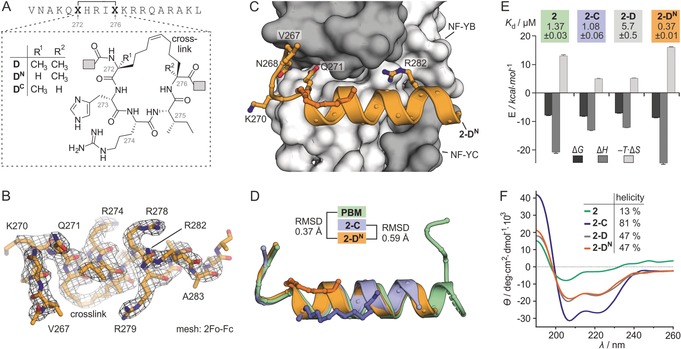
A) Chemical structures of macrocycles D, DN and DC as found in peptides 2‐D, 2‐DN and 2‐DC. B) Electron‐density map (2 F o−F c, level 1σ) of 2‐DN originating from the complex with NF‐YB/C (PDB ID: 6qmq, Table S2). C) Crystal structure (PDB ID: 6qmq) of 2‐DN (orange cartoon representation) in complex with NF‐YB/C (grey surface representation). Selected 2‐DN side chains are shown as ball‐and‐stick representations. D) Superimposition of the PBM, 2‐C, and 2‐DN originating from their complexes with NF‐YB/C (PDB IDs: 6qmp, 6qms and 6qmq; for overlays including protein surface, see Figure S14/15). E) Thermodynamic profile as determined by ITC, including K d values (measurements were performed in triplicate, errors account for 1σ; for full data see Table S3 and Figure S8, S9, S16, S17). F) CD spectra in buffer (pH 7.4, c(peptide)=75 μm) and calculated helical content (for complete secondary‐structure distribution, see Table S4).
