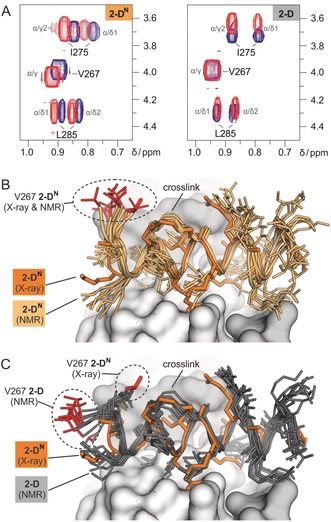
Figure 4.

A) 2D 1H‐1 H‐TOCSY spectra of peptide 2‐D and 2‐DN in aqueous buffer in the presence (red) and absence (blue) of NF‐YB/C (for overview of involved residues groups, see Figure S18). B) Superposition of the crystal structure of 2‐DN (orange, X‐ray) bound to NF‐YB/C (grey surface, PDB ID: 6qmq) and of the 10 lowest‐energy peptide conformers of 2‐DN (light orange, NMR). Peptide backbones are shown as cartoon and side chains as stick models. The side chain of amino acid V267 is highlighted (red) in all structures. C) Superposition of the crystal structure of 2‐DN (orange, X‐ray) bound to NF‐YB/C (grey surface, PDB ID: 6qmq) and of the 10 lowest energy peptide conformers of 2‐D (dark grey, NMR). Peptide backbones are shown as cartoons and side chains as stick models. The side chain of amino acid V267 is highlighted (red) in all structures. Coordinates of the top ten NMR structures for bound 2‐DN and 2‐D are available as supporting material.
