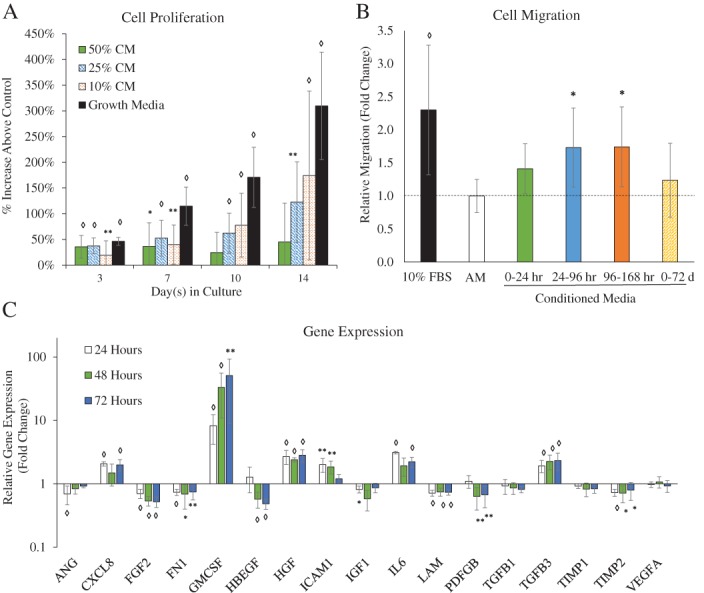
Figure 5.

dACM CM induces an angiogenic responses in vitro. (A) quantitative proliferation assay in assay media alone or dACM CM in assay media (with 50%, 25%, and 10% CM by volume, n = 17); (B) quantitative analysis of HMVEC migration in assay media, growth media, or dACM CM (n = 16); (C) gene expression changes (at 24, 48, and 72 hours) in dACM (relative to assay media) with GAPDH as the internal control (n = 9) Average ± standard deviation, significance compared to assay media is denoted by: * denotes p < 0.05, ** denotes p < 0.01, and ◊ denotes p < 0.001.
