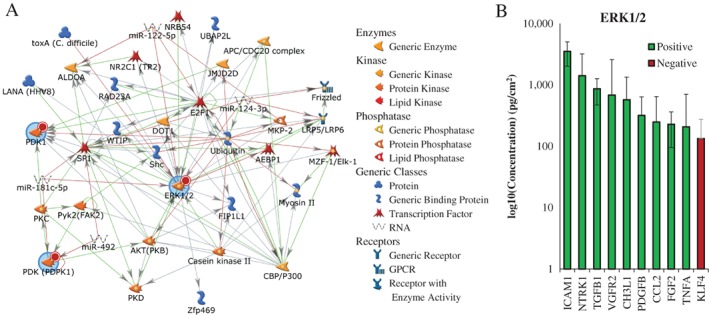
Figure 7.

(A) Inferred protein network (MetaCore) from activated kinases (blue circles). Network was auto‐expanded to a maximum of 50 nodes. Red circles indicate query kinases increased in CM treated cells. Arrow heads denote direction of literature‐annotated interactions with color of line indicating type (red is negative, green is positive, gray is complex or unknown). MetaCore symbol legend on right. (B) Protein levels of positive and negative regulators of the ERK1/2 cascade based on GO annotation. Bars are average across all donors and are colored according to direction of angiogenic modulation: green are positive regulators (GO:0070374), red are negative regulators (GO:0070373). Error bars are standard deviation.
