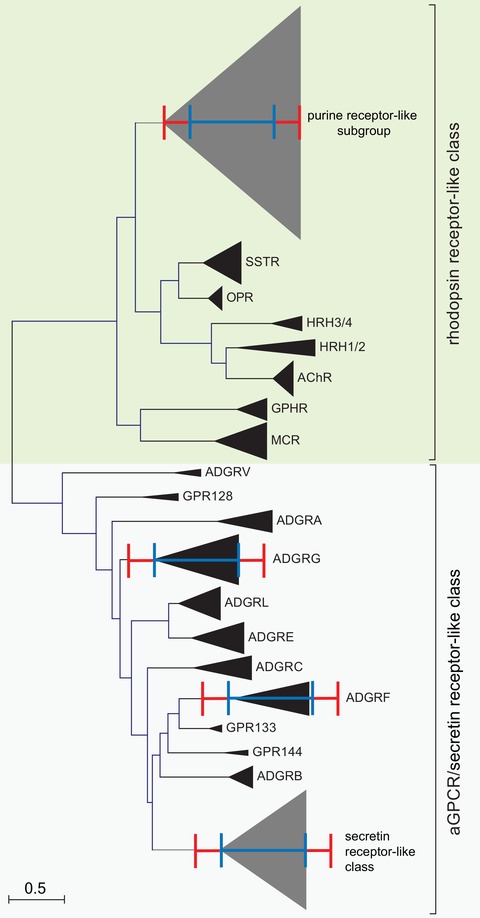
Figure 2.

Molecular phylogenetic analysis of selected rhodopsin‐like GPCRs, secretin receptor–like GPCRs, and aGPCRs by the maximum likelihood method. The evolutionary history was inferred by using the maximum likelihood method based on the JTT matrix–based model.70 The tree with the highest log likelihood (–52401.93) is shown. Initial tree(s) for the heuristic search were obtained automatically by applying neighbor‐joining and BioNJ algorithms to a matrix of pairwise distances estimated using a JTT model, and then selecting the topology with superior log likelihood value. The tree is drawn to scale, with branch lengths measured in the number of substitutions per site. The analysis involved 425 amino acid sequences, where orthologous sequences of human, mouse, chicken, and zebrafish were included when available. All positions containing gaps and missing data were eliminated. There was a total of 129 positions in the final dataset. Evolutionary analyses were conducted in MEGA7.22 The orthologs and paralogs of individual receptors and receptor subgroups, respectively, were condensed and depicted as triangles. The red and blue scale bars represent the branch lengths of the purine cluster within the delta group and secretin class members, respectively.
