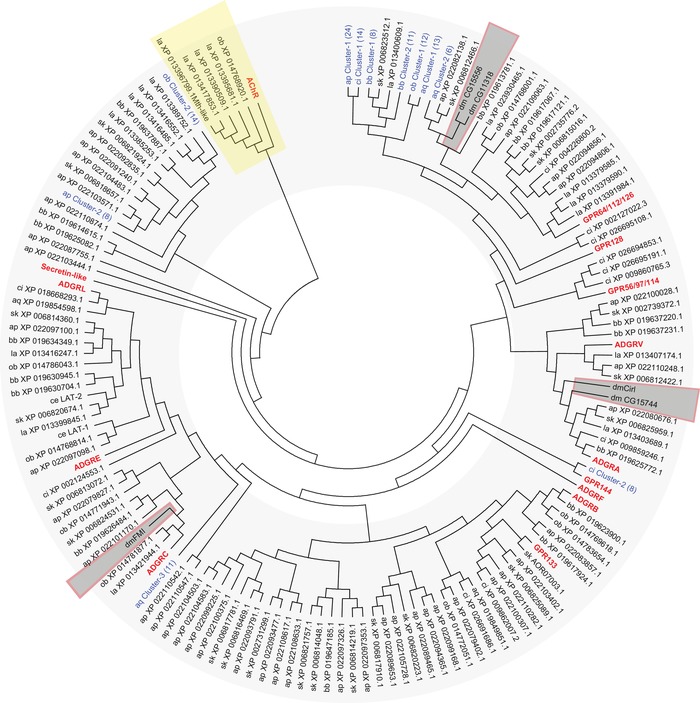
Figure 5.

Phylogenetic analysis of selected invertebrate and vertebrate aGPCRs. The evolutionary relationships of selected invertebrate aGPCRs and human, mouse, chicken, and zebrafish aGPCRs are shown. Muscarinic acetylcholine receptors (AChR) served as the outgroup. The evolutionary history was inferred using the neighbor‐joining method.67 The optimal tree with the sum of branch length = 138.25837393 is shown. The evolutionary distances were computed using the Poisson correction method69 and are in the units of the number of amino acid substitutions per site. The analyses involved 525 amino acid sequences. All positions with less than 95% site coverage were eliminated. That is, fewer than 5% alignment gaps, missing data, and ambiguous bases were allowed at any position. There was a total of 183 positions in the final dataset. Evolutionary analyses were conducted in MEGA7.22 Current subfamilies of aGPCRs are condensed and shown in bold red characters. aGPCR clusters found in invertebrates are shown in blue and the number of receptors included in the cluster is given in parenthesis. Species included in the analysis (aGPCRs from D. melanogaster, including the newly identified genes, are boxed): vertebrate: Homo sapiens (hs), Mus musculus (mm), Gallus gallus (gg), Danio rerio (dr); Cephalochordata: Branchiostoma belcheri (bb); Tunicata: Ciona intestinalis (ci); Hemichordata: Saccoglossus_kowalevskii (sk); Brachiopoda: Lingula anatina (la); Echinodermata: Acanthaster planci (ap); Mollusca Octopus bimaculoides (ob); Neoptera: Drosophila melanogaster (dm); Nematoda: Caenorhabditis elegans (ce); Parazoa: Amphimedon queenslandica (aq).
