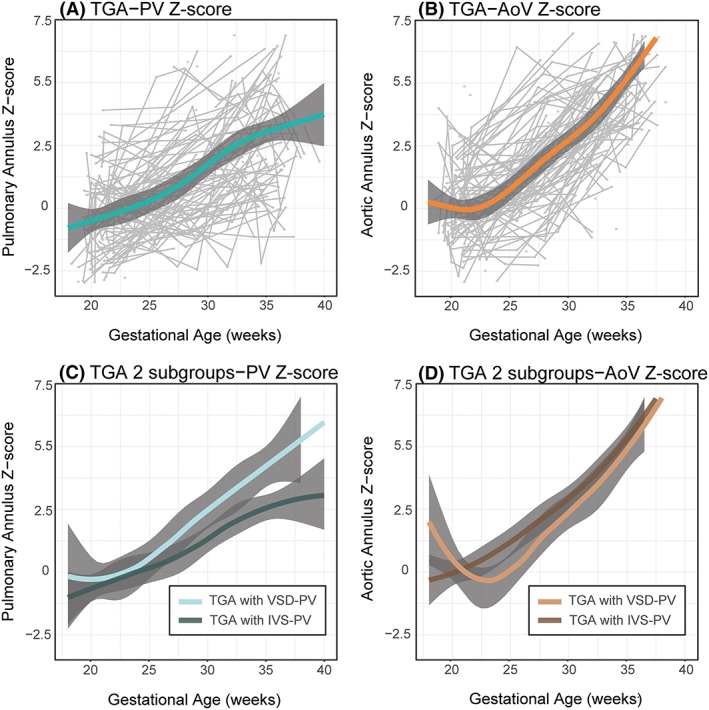
Figure 4.

Average trend in TGA fetal (A) PV annular diameter Z‐score (TGA‐PV Z‐score) and (B) AoV annular diameter Z‐score (TGA‐AoV Z‐score). Grey dots are individual measurements, and grey lines are individual trends. Both trends were stratified on the basis of the presence (TGA with VSD) or absence (TGA with IVS) of a VSD (C) and (D) respectively. AoV, aortic valve; IVS, intact intra‐ventricular septum; PV, pulmonary valve; TGA, transposition of the great arteries; VSD, ventricular septal defect. Z‐scores based on data from Vigneswaran et al21 [Colour figure can be viewed at http://wileyonlinelibrary.com]
