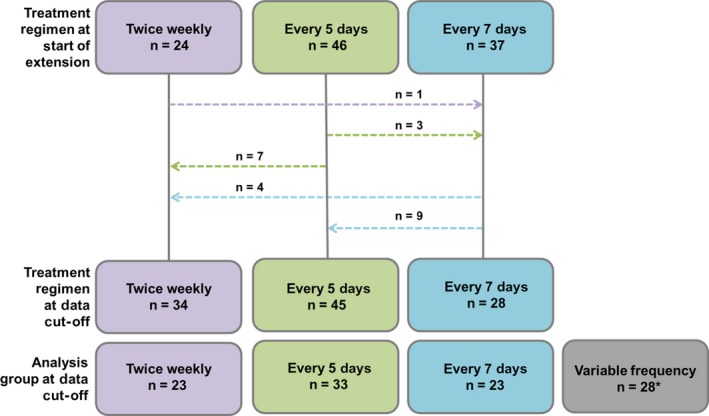
Figure 1.

Patient movement across treatment regimens during the extension study. *The variable frequency group included all patients depicted who finished with a different regimen than their initial regimen (n = 24) as well as 1 patient in the every‐7‐days group and 3 patients in the every‐5‐days group who switched twice (ending up back on their original treatment regimen). The analysis group at data cut‐off refers to the group in which patients were included for the statistical analysis [Colour figure can be viewed at http://wileyonlinelibrary.com]
