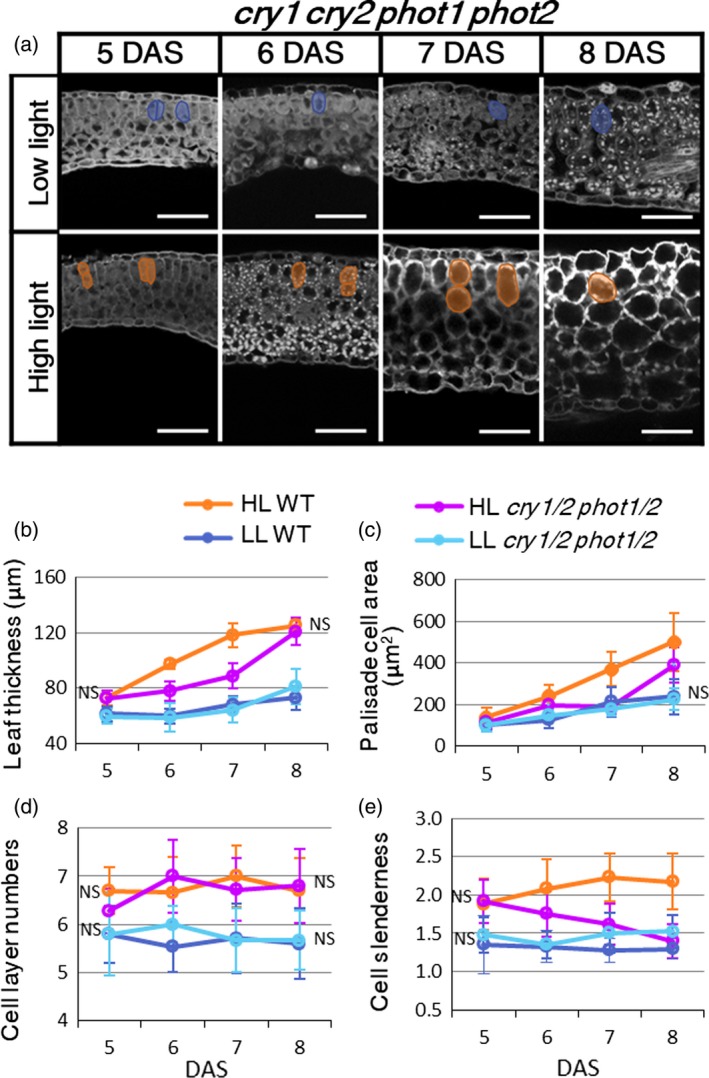
Figure 5.

Time‐course analysis of leaf‐thickness growth in cry1 cry2 phot1 phot2 mutant. (a) Leaf longitudinal sections of cry1 cry2 phot1 phot2 (cry1/2 phot1/2) mutants grown under low light (LL) or high light (HL) conditions from 5–8 days after sowing (DAS). Typical mesophyll tissue cells of each leaf sample are outlined. Scale bars: 50 μm. (b) Leaf thickness, (c) cross‐sectional area of palisade cells, and (d) the number of cell layers were measured from the longitudinal images. (e) Cell slenderness (ratio of cell height and width) in palisade cells was also calculated from the same images. Values represent means ± SDs (n > 3 plants). Absence of NS means significant difference by Sidak's test (P < 0.05), when the cry1 cry2 phot1 phot2 is compared with the wild type under each light condition.
