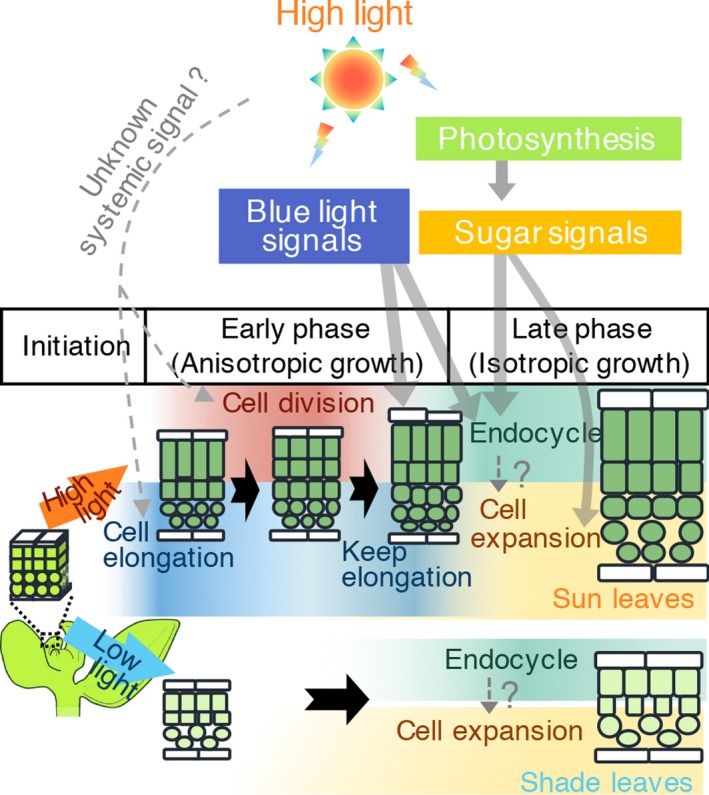
Figure 7.

Developmental framework of leaf thickening in sun and shade leaves. Diagrams represent cross‐sectional images of leaves at each developmental stage. A detailed explanation is provided in the discussion section in the text. Upper and lower halves show sun‐ and shade‐leaf formation, respectively. Leaf development progresses from left to right. Bold black arrows indicate developmental steps, and thin grey arrows indicate the effects of sugar and blue‐light signals from cryptochromes and phototropins on leaf development. Dotted lines indicate the hypothetical pathways.
