
Figure 3.
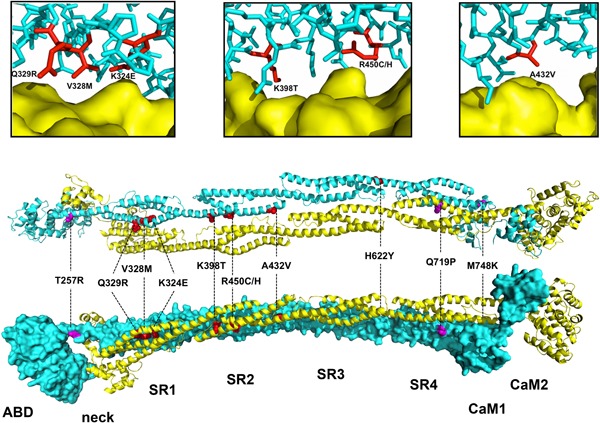
Visualization of the ACTN1 variant protein structures. The dimeric structure of ACTN2 was assembled from two halves of the ACTN2 protomer (AB domain‐neck‐SR1‐SR2‐SR3‐SR4‐CaM1‐CaM2) through a crystallographic twofold axis. One monomer is represented as a blue surface (bottom view) and the other is shown as a yellow ribbon (top view). The two views are rotated 90° around the horizontal axis. Residues corresponding to the variants in ACTN1 are indicated in red when located at the dimer interface and in purple when located elsewhere. The upper panels correspond to close‐up views of the p.(Lys324Glu), p.(Gln329Arg), p.(Val328Met), p.(Lys398Thr), p.(Arg450Cys), and p.(Ala432Val) variants. The monomer colored in blue is shown in stick representation with the residues corresponding to the variants colored in red. The other monomer is represented as a yellow surface. ACTN1, α‐actinin‐1; CaM, calmodulin