
Figure 7.
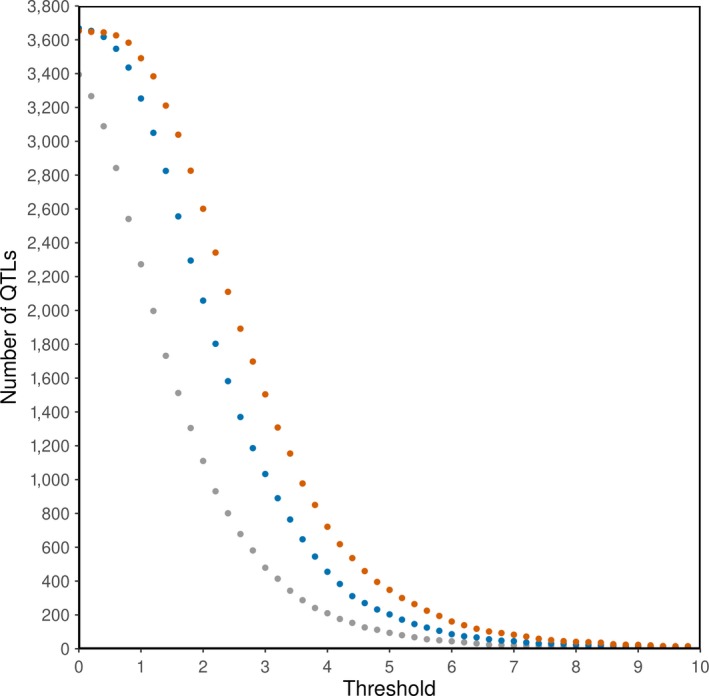
Number of QTL regions with a significance level above a range of significance thresholds (without correction) for medium density (grey), high density (blue) and iWGS (orange)
Official websites use .gov
A
.gov website belongs to an official
government organization in the United States.
Secure .gov websites use HTTPS
A lock (
) or https:// means you've safely
connected to the .gov website. Share sensitive
information only on official, secure websites.
Number of QTL regions with a significance level above a range of significance thresholds (without correction) for medium density (grey), high density (blue) and iWGS (orange)