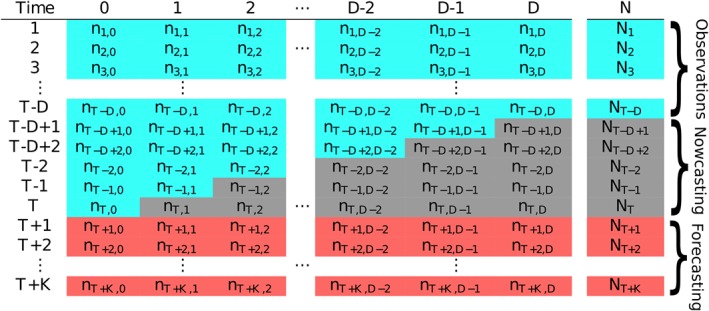
Figure 1.

Table illustrating the typical data structure in a reporting delay problem. The values in the blue cells are fully observed number of cases at time as of time T (today), the values in grey are the occurred‐but‐not‐yet‐reported number of events (run‐off triangle), and the values in red are the future number of event we may be interested to forecast [Colour figure can be viewed at http://wileyonlinelibrary.com]
