Figure 6.

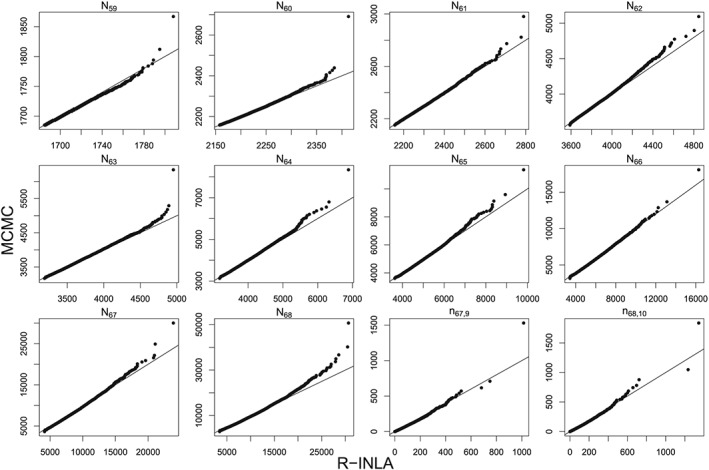
Q‐Q plots comparing R‐INLA and MCMC samples from the predictive distribution of the total counts N t for t=59,…,68, where T=68 is the 15th epidemic week of 2012. INLA, integrated nested Laplace approximation; MCMC, Markov chain Monte Carlo

Q‐Q plots comparing R‐INLA and MCMC samples from the predictive distribution of the total counts N t for t=59,…,68, where T=68 is the 15th epidemic week of 2012. INLA, integrated nested Laplace approximation; MCMC, Markov chain Monte Carlo