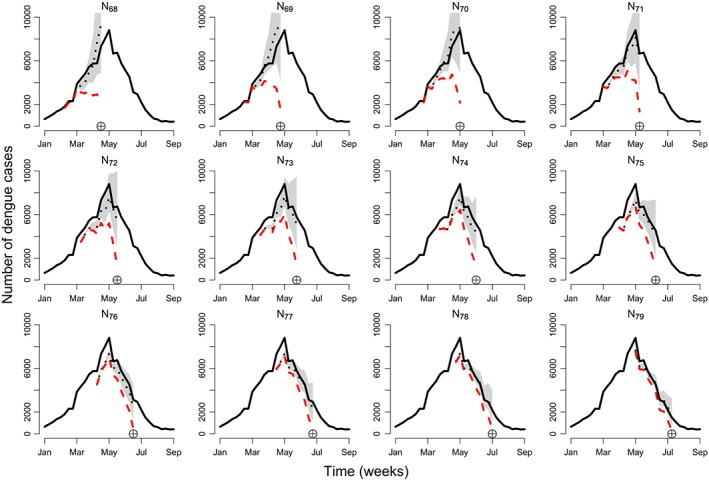
Figure 8.

Time series of dengue cases in Rio de Janeiro for 12 epidemic weeks starting from the 15th epidemic week of 2012 on the top left (T=68). The black line shows the eventually reported number of cases, the red dashed line shows the number of currently reported cases, and the black dotted line shows model predictions (of the eventually reported number of cases) along with 95% prediction intervals. The circled cross symbol indicates the epidemic week T=68,69,…,79 [Colour figure can be viewed at http://wileyonlinelibrary.com]
