
Figure 10.
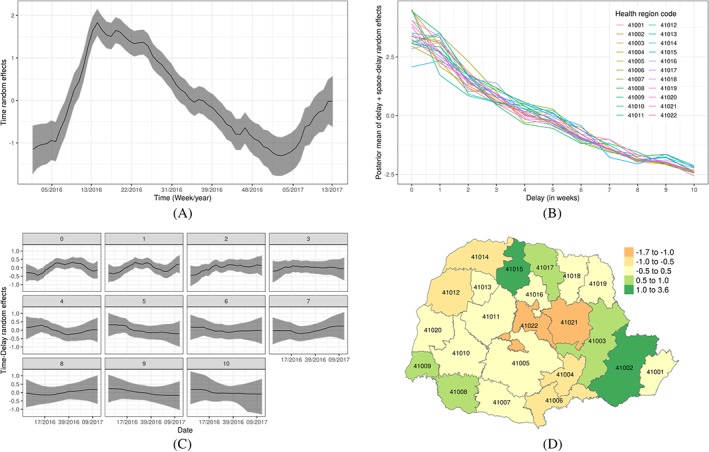
Estimates of the various random effects. A, Posterior mean with 95% credible intervals for time random effects α t; B, Posterior mean of the space‐delay random effects β d+β d,s by health regions; C, Posterior mean of the time‐delay random effects γ t,d by delayed weeks; D, Posterior mean of the spatial random effects ψ s [Colour figure can be viewed at http://wileyonlinelibrary.com]