Figure 3.

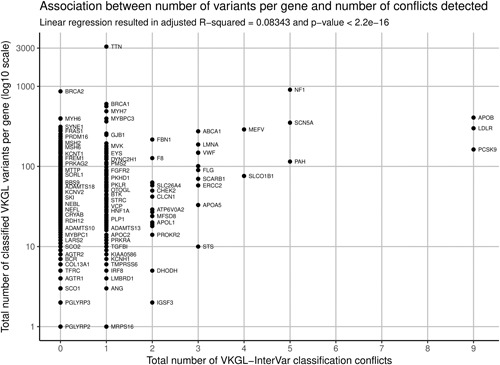
Total number of VKGL classifications per gene plotted against the total number of discrepancies with InterVar classifications. A linear regression shows a significant but only slight trend, explaining <9% of the observed variation

Total number of VKGL classifications per gene plotted against the total number of discrepancies with InterVar classifications. A linear regression shows a significant but only slight trend, explaining <9% of the observed variation