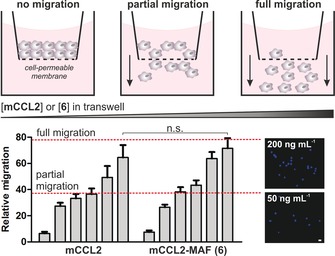
Figure 3.

Chemotactic transwell assays in RAW264.7 macrophages. Migrated cells were quantified after incubation with culture media containing increasing levels of mCCL2 or 6 (0, 10, 25, 50, 100 and 200 ng mL−1) for 2 h. Cells were stained with DAPI (representative images on the right) and counted using ImageJ. Scale bar: 10 μm. Values as means ± s.d. (n=3). n.s. for p>0.05.
