Figure 4.

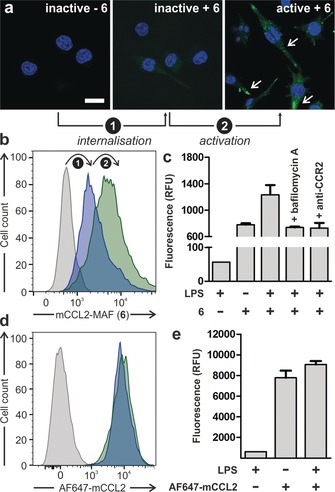
Fluorescence microscopy (a) and flow cytometric analysis (b–e) of inactive and active CCR2+ mouse macrophages upon treatment with LPS (100 ng mL−1 for 18 h), compound 6 (100 nm, b,c), and AF647‐mCCL2 (100 nm, d,e). Cells were counterstained with Hoechst 33 342 for nuclear staining. In panel (a) white arrows point at fluorescent acidic phagosomes inside macrophages. Scale bar: 10 μm. Values are presented as means ± s.d. (n=3).
