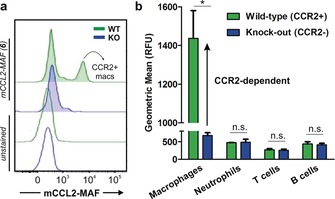
Figure 5.

Ex vivo staining profile of compound 6 (100 nm) in different immune cells from spleens of wild‐type and Ccr2 KO mice. a) Representative fluorescence histograms of compound 6‐stained and unstained macrophages from wild‐type mice (green) and Ccr2 KO (blue) mice (n=3 for each group). b) Geometric fluorescence intensity of immune cells: macrophages (Ly6G−F4/80+CD11b+), neutrophils (Ly6G+F4/80−), T cells (CD3+CD19−), and B cells (CD3−CD19+). Values as means ± s.d. (n=3). * for p<0.05, n.s. for p>0.05.
