
Figure 1.
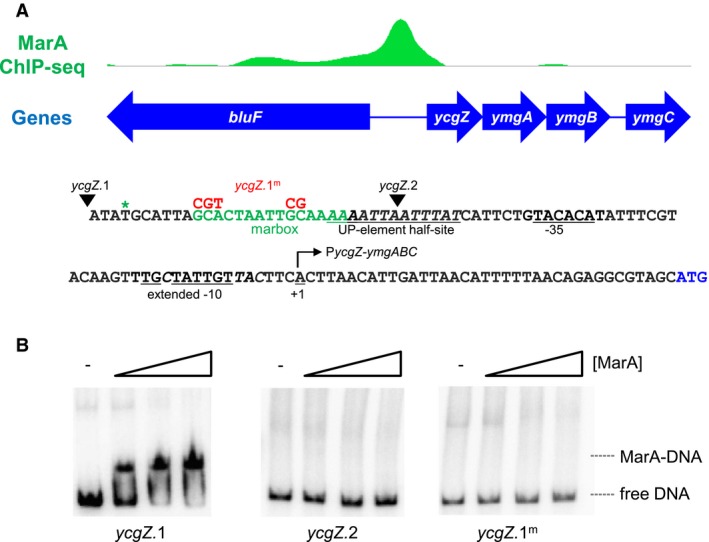
Binding of MarA to the ycgZ‐ymgABC intergenic region.
A. ChIP‐seq data for MarA binding at the ycgZ‐ymgABC locus. Genes are shown as blue arrows and the ChIP‐seq data for MarA binding is in green (ArrayExpress accession number E‐MTAB‐5521). The sequence of the intergenic region, corresponding to the ycgZ.1 DNA fragment, is shown below the ChIP‐seq profile. The sequence of the predicted marbox is in green and the centre of the ChIP‐seq peak for MarA is denoted by an asterisk. The ycgZ‐ymgABC transcription start site is indicated by a bent arrow and the promoter extended −10 and −35 elements are underlined. Bases in italic are important for conferring recognition by σ38. Mutations introduced in the ycgZ.1m DNA fragment are shown above the wild type DNA sequence in red. The 5' ends of the ycgZ.1 and ycgZ.2 DNA fragments are indicated by inverted triangles.
B. Binding of MarA to the ycgZ‐ymgABC intergenic region in vitro requires the predicted marbox. The results of electrophoretic mobility shift assays are shown for different derivatives of the ycgZ‐ymgABC intergenic region. Where present, MarA was used at concentrations of 0.4, 1.2, or 2.0 μM. [Colour figure can be viewed at https://www.wileyonlinelibrary.com]