
Figure 8.
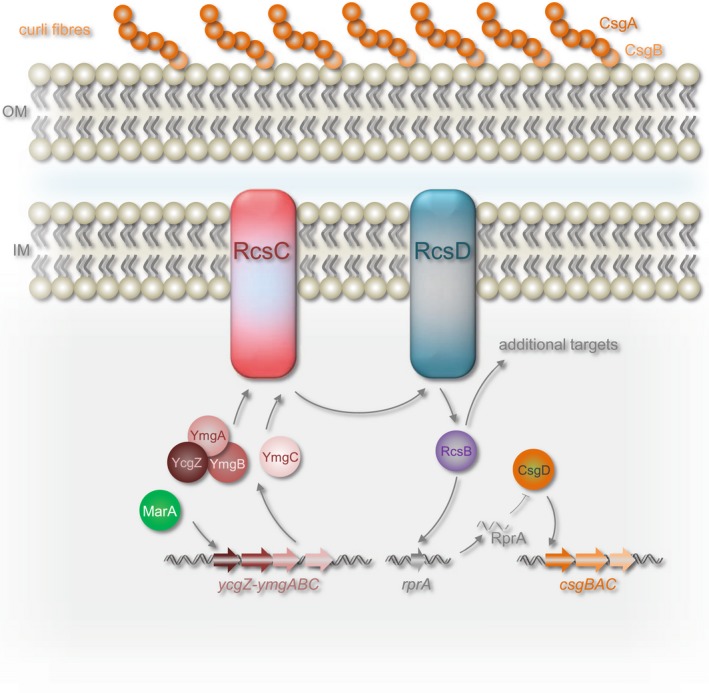
Model for repression of biofilm formation by MarA. Genes are shown as block arrows and proteins are shown as spheres or ovals. Stimulatory and inhibitory interactions are shown by arrows and bar‐headed lines respectively. Nucleic acids are shown as double (DNA) or single (sRNA) wavy lines. The inner membrane (IM), outer membrane (OM) and curli fibres are labelled. [Colour figure can be viewed at https://www.wileyonlinelibrary.com]